
The CBI is inflating Britain's Net Zero economy
The recent CBI report is puffing up Net Zero’s economic dividends. Government data describes a much smaller sector that will not offset industrial decline.


This week, the CBI released a report arguing that Britain’s net zero economy had a gross value added (GVA) of £83 billion. This is roughly a copy of a previous CBI report in February 2024, which put the GVA at £74 billion. In theory, a sector growing 10% per annum, with a GVA approaching £100 billion, is clearly in rude health and is worth prioritising through industrial policy. For context, manufacturing GVA is about £200 billion.
But while the report is polished, I think it paints a very skewed picture of Net Zero and its relative worth to Britain. This is important since the report is being used by advocates of a strong Net Zero programme like Ed Miliband to press on with current policy under the promise we will come out the other side with a more substantial industrial base. While Net Zero touches all sectors, it is very clearly being framed as a way for British manufacturing to become more competitive.
It is worth understanding the £83 billion figure. The report itself acknowledges that the direct Net Zero economy has a GVA of £29 billion in 2024 money, with 273,800 workers, meaning a GVA per worker of £106,000. It then adds on £35 billion in supply chain activity and £19 billion in employee spending to get the resulting £83 billion figure. It also adds hundreds of thousands of employees from these groups to reach the stated 951,400 jobs.
Now, when people are trying to understand the Net Zero economy, I think they mean products and infrastructure like heat pumps, wind turbines, solar panels, electric vehicles etc. They are not factoring in the weekly shop of an SSE employee. Likewise, when the supply-chain activity has a higher GVA than the actual industry covered, I think we can say this is too broad.
So, let's take the £29 billion GVA for direct renewable businesses. On the face of it, this still seems quite large: about 15% of manufacturing GVA. I am going to go out on a limb and suggest this estimate is roughly equivalent to the ONS’s Low Carbon and Renewable Energy Economy (LCREE) Survey. This is because the employment figure cited by the CBI is 272,800, while for the latest LCREE year, the sector had employment of 272,400. A GVA of £29 billion suggests a turnover of around £60-£70 billion, which stacks with the LCREE.
Growth in energy rents
LCREE is an excellent and very detailed source of information, although it was last published in early 2024 and currently only from 2014 to 2022. I mentioned it in a previous post. It does not cover GVA but rather turnover in current prices. Its rich data makes it very useful for determining how big the Net Zero sector is.
From 2014 to 2022, the LCREE turnover (in real terms) has grown from a turnover of £53 billion to £69 billion. When broken down by sector, 84% of this turnover was in manufacturing, construction, electricity, gas and steam generation or air-conditioning as of 2022.

Figure 1: LCREE real turnover (CPI 2022 = 100) from 2014 to 2022. Source: LCREE.
The LCREE, as we can see, was stagnant between 2014 and 2020 and then rocketed up post-Covid. This is fundamentally down to increases in turnover for generators. From 2014 to 2022, the generation component of LCREE grew from 21% to 32%, while manufacturing’s share decreased from 31% to 28%. Construction has remained roughly 25% of overall turnover. From this, we can already see that only a minority of Net Zero turnover is related to Green products or services. Most of it is held in electricity generation of construction, which to a great extent would be happening anyway.
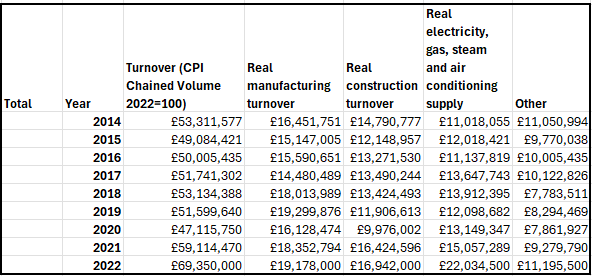
Figure 2: LCREE real turnover (£ thousands) by sector (CPI 2022 = 100). Source: LCREE.
LCREE splits turnover by sector (manufacturing, generation, construction). But it also splits between industry groups (wind, solar, vehicles, lighting etc.). From this, we can see where the revenue for specific industries is coming from. Is it manufacturing or energy rents and construction?
Looking at offshore wind, onshore wind and the solar industry is illustrative. These are the big charismatic industries that, alongside EVs, define the sector’s promise to policymakers. A successful Net Zero strategy would involve increased revenues from the generation and construction of wind and solar assets, but also greater manufacturing revenue with the promise of big export orders.
Wind and solar are a big component of the LCREE, with a turnover of £20 billion in 2022, or 30% of turnover. Despite the promise that these industries will revitalise British manufacturing, over 90% of their turnover in 2022 was tied up in either construction, or the money generators and utilities get for selling their electricity.
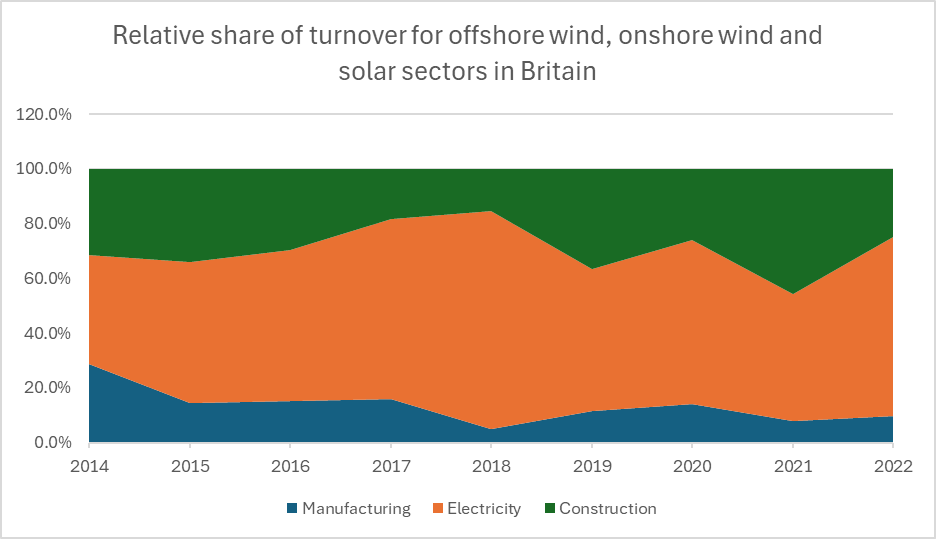
Figure 3: Manufacturing, generation and construction share of LCREE 2014 to 2022. Source: LCREE.
It is no surprise then that the CBI report states that employees in electricity generation are by far the most productive in terms of GVA per worker. In 2023, we had record-high electricity prices. From the perspective of manufacturers, this was terrible, but from the perspective of generator turnover, it was brilliant.
The Wind and solar industries may be growing industries as far as utilities and builders are concerned, but in terms of production, they are tiny. Their collective manufacturing turnover in 2022 was about £2 billion, roughly £1 billion less than the processing and preserving of fish, crustaceans and molluscs. It is important to keep this in mind when Ed Miliband and Chris Stark are touring the Hull wind turbine factory in high-vis jackets and hard hats, extolling the future of British industry.

Figure 4: Wind and solar manufacturing 2022 turnover compared to other selected industry turnovers. Source. LCREE and UK manufacturers' sales by product: 2023.
Alarmingly, manufacturing turnover has not progressed since 2014, suggesting there has been very little, if any, progress in onshoring these activities despite them being given a huge amount of government preference.

Figure 5: Manufacturing real turnover of offshore wind, onshore wind and solar industries from 2014 to 2022. Source: LCREE.
What about cars, storage, and lightbulbs?
Measured by industry group, LCREE turnover is becoming more tied to generation over time. Low carbon electricity (involving all electricity generation assets), renewable heat and biomass (assets like Drax) went from 43% of turnover in 2014 to 55% of turnover in 2022. This includes all the manufacturing, construction and other sectoral components of turnover.
So if over half of Net Zero is primarily the activity of generation, what is the rest? Low-carbon services, meaning consultancies and advisory services, such as Cornwall Insight, cover a tiny segment, with just over £1 billion in turnover (less than 2% of overall LCREE turnover). Around 30% comes from energy-efficient products (lighting, monitoring and control systems, energy-efficient doors and windows, ventilation systems, insulation and sustainable materials). The rest (roughly 15%) comes from low-emissions vehicles, charging infrastructure, fuel cells and energy storage. I will focus on these industries as they are not tied to generation but rather the creation of intermediate goods and durable consumer goods.
From 2014 to 2022, LCREE shows these sectors grew real turnover from £29 billion to £31 billion. Of that, turnover related to manufacturing grew from £13 billion to £15 billion. Much of the rest of the money was in construction, particularly for energy-efficient products like insulation and doors. While there has been growth in low-emission vehicle production, this is partially the result of government interference in the motor industry (demanding certain types of cars be prioritised).
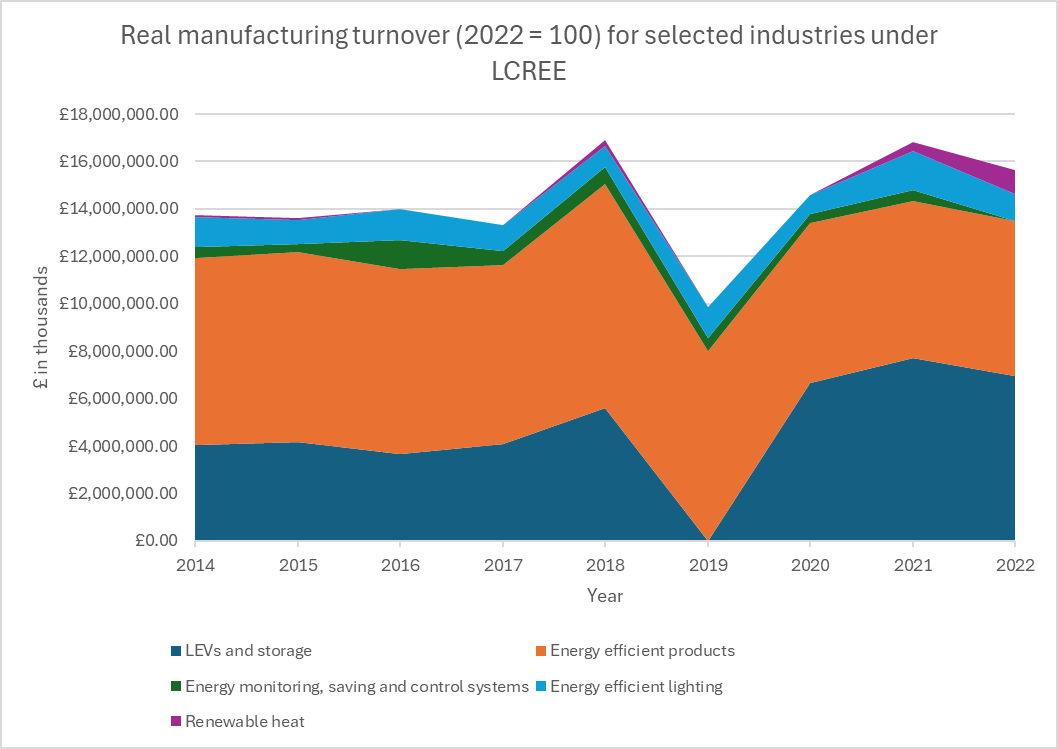
Figure 6: Real manufacturing turnover for LEVs and storage, energy-efficient products and renewable heat. Source: LCREE.
So when we dig down, the Net Zero economy is less than 30% manufacturing, and the majority is energy generation and construction. Relying on higher electricity bills and construction for the industry’s growth does not bode well. We could follow Italy’s “super bonus” scheme (where the government subsidised green home renovations) and it would see LCREE turnover rocket up into the hundreds of billions of pounds. But it would do nothing for long-term growth, the industrial base of the financial health of the nation.
What is manufacturing is very limited, and tiny when compared to British production at large. As of 2022, manufacturing turnover is £439 billion. “Net Zero” manufacturing, at just under £20 billion according to LCREE, is 4.4% of total British manufacturing turnover. This is less than the manufacture of plastic and rubber products. Not to denigrate these industries, but would we have whole departments and industrial strategies built around rubber and plastics?
The figure below should give a sense of scale. While we can accept the validity of lowering carbon emissions, it does feel a bit out of shape to build our industrial strategy on such a small sector, especially as we have made manufacturing so hard in Britain. This should also lead us to question why recent governments have staked so much of our future on a green industrial renaissance.
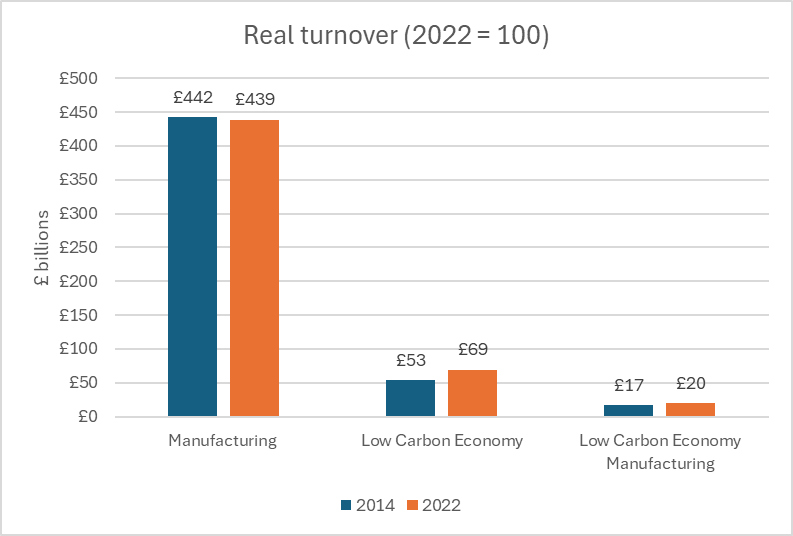
Figure 7: Real turnover of manufacturing, LCREE and LCREE manufacturing. Source: Manufacturing product sales (ONS), LCREE (ONS).
Why focus on Manufacturing?
But why is it a problem that so much of the value of Net Zero is held in electricity generation and construction? Well, 2022’s bumper year for LCREE revenue was facilitated by sky-high electricity prices. High revenues for generators and utilities seem less rosy when one considers the UK uses less electricity every year. This particularly applies to energy-intensive industries. For example, British chemical manufacturers have reduced both production and energy consumption considerably since 2020.

Figure 8: Chemical and chemical products index of production (2022 = 100) and calorific input in thousands of tonnes of oil equivalent (ktoe). Source: ONS.
The CBI report from 2024 finds those in electricity, gas, steam and air conditioning supply had the highest productivity in the Net Zero economy, with an estimated £239,000 in GVA per job. This is like saying Saudi Arabia is the most productive economy on the planet or that we should try to make electricity generation as big a proportion of GDP as possible.
We can see below that, compared to 2000, the generation sector is putting more hours in to produce substantially less electricity. If this results in significant revenue increases, these are, to a great extent, being built on increased bills for manufacturers and consumers.

Figure 9: Hours worked (average hours per week) in the generation sector and indigenous electricity production. Source: ONS and BEIS.
It is also worth noting that the LCREE’s £69 billion in 2022 turnover is held up heavily by government spending. The Office for Budget Responsibility (OBR) estimates annual Net Zero spending at about £20 billion. This includes carbon credits, levies, network costs and the capacity market. A great portion of the LCREE turnover is just spending being moved from the taxpayer to generators via the government.
Why, then, should manufacturing determine the Net Zero economy’s success or failure? The manufacturing component of Net Zero is the most critical because we are anticipating that the old manufacturing base will have to be replaced. We are outlawing internal combustion engine sales in 2030 on the premise we can produce electric vehicles and hybrids at scale. We have an effective 78% tax on oil and gas production because we think these jobs can be recovered by manufacturing wind turbines or solar photovoltaics. We are putting huge pressure on our steel industry in the belief we can make it carbon-neutral. But based on LCREE, Net Zero manufacturing is tiny and not growing significantly.
Net Zero is not at the current rate even helping our trade balance, with the LCREE documenting a minor trade deficit consistently between 2014 and 2022. While this is by no means the worst of Britain’s trade problems, it does show our failure to turn aspirations of a green industrial revolution into a domestic supply chain that can give us big export wins. Considering the high rate of foreign ownership in British manufacturing and electricity generation assets, this sector is a net negative for the current account.

Figure 10: Trade balance of LCREE from 2014 to 2022. Source: LCREE.
Conclusion
When the CBI argues Net Zero is growing at triple the rate of the UK economy at large, it's worth asking why that is. At present, most of our green growth is in the higher cost of electricity we all endure through levies, increased network costs and capacity markets, and increased costs of construction. This sector is not following the invisible hand but rather is being mandated to grow through increased subsidies and regulations, which are hampering our much larger manufacturing sector.
In conclusion, the CBI’s assertion of Net Zero having a GVA of £83 billion is a massive stretch. If we take the sector itself rather than associated supply chain activity and employee consumption, it has a GVA of £29 billion. This is already a major inflation, but I argue it should be reduced further. When we investigate the LCREE, we find about 30% of turnover is just energy rents. When we focus on manufacturing (as I believe we should), overall turnover is £20 billion (28% of turnover), suggesting a Net Zero manufacturing GVA of £10-£12 billion, or about 5% of manufacturing GVA. If we are betting British manufacturing on a green future, our entire strategy needs a major reassessment.
Notes
1: For clarity, turnover is the total income a company generates from selling goods or services. GVA is turnover minus intermediate purchases and costs. For this reason, depending on how value-added an industry is, GVA is usually somewhere between 40% and 60% of turnover.
2: I have recalculated its current prices into real prices using the CPI index, with 2022 set as 100.
Excellent breakdown. Officials in DBT, DESNZ, HMT etc must be aware of these figures, right? So are they just being overruled by naive ideological commitment to net-zero by government? Or does everyone who’s making decisions about energy policy and industrial strategy just not have a clue about how to generate growth and stimulate domestic manufacturing?