A short post this time
This is an assortment of graphs concerning Britain’s power sector. This is very far from a complete analysis. My hope is they will provide some mild chuckling / blackpilling.
We all know the power sector has received a lot of attention from the British government. Decarbonisation has been one of the most significant policy priorities of successive Labour and Tory regimes this century. While clean sources now produce a majority of power, there have been other developments:
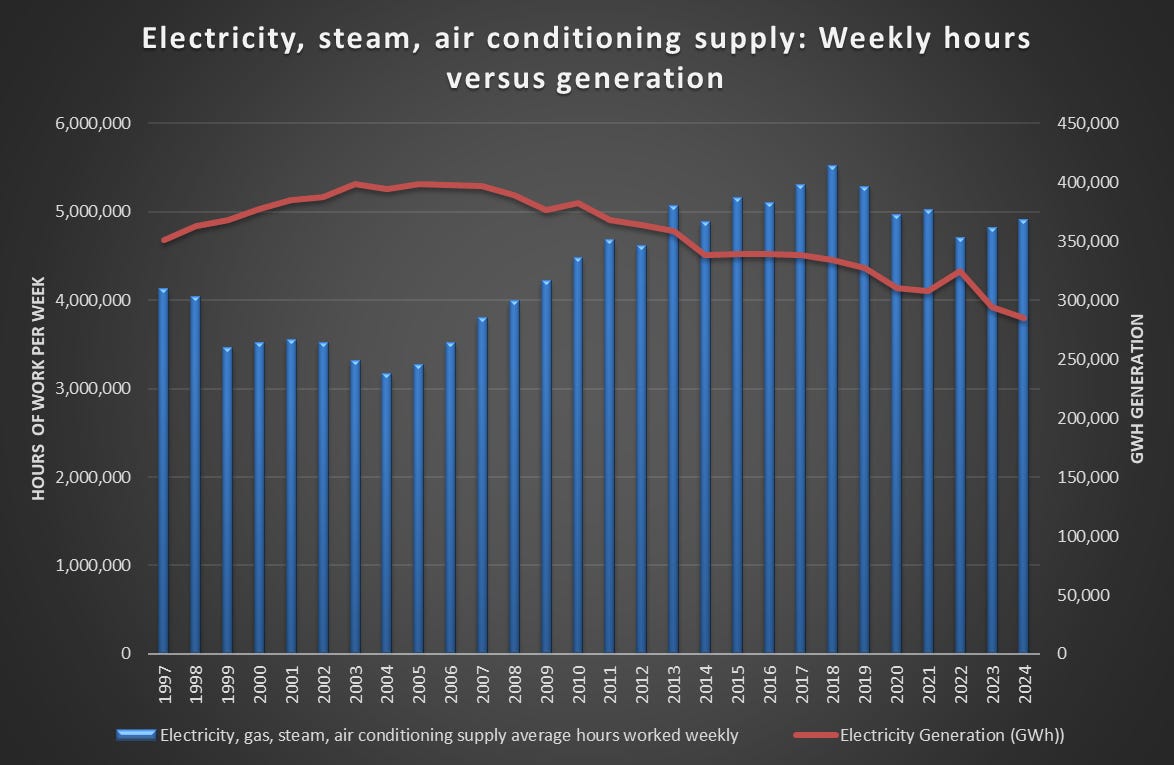
There are more hours of work being put into generation than ever, roughly five million hours a week versus just over three million in 2003.
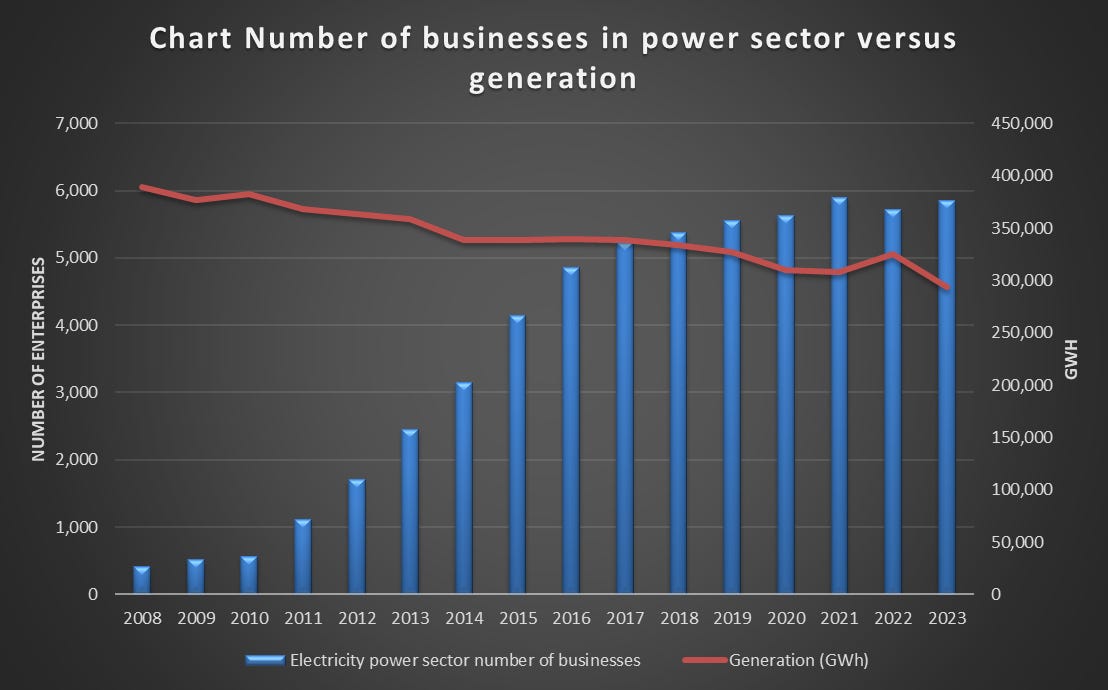
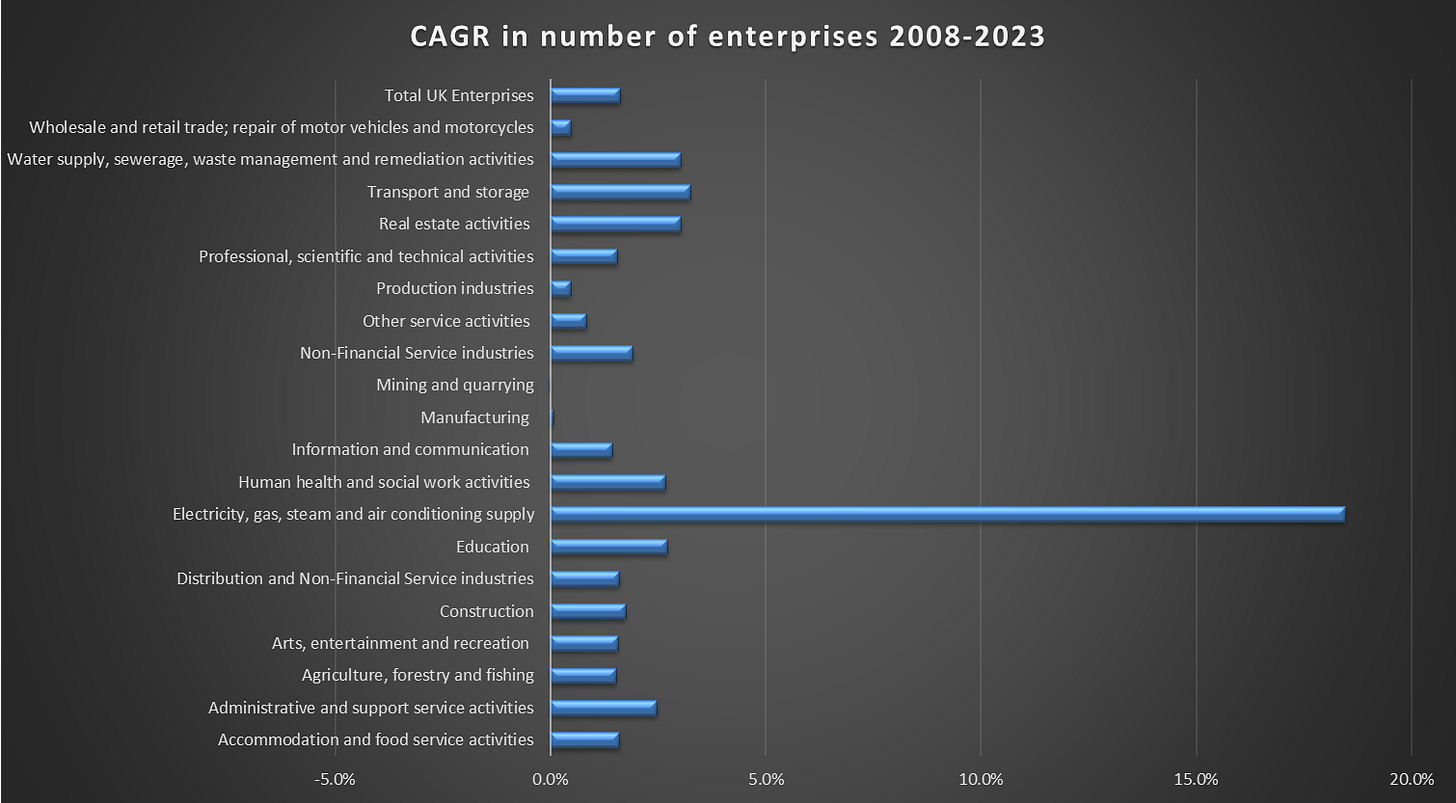
The number of companies involved in electricity generation, transmission and trading has multiplied by fifteen from around 400 to nearly 6,000 between 2008 and 2024.
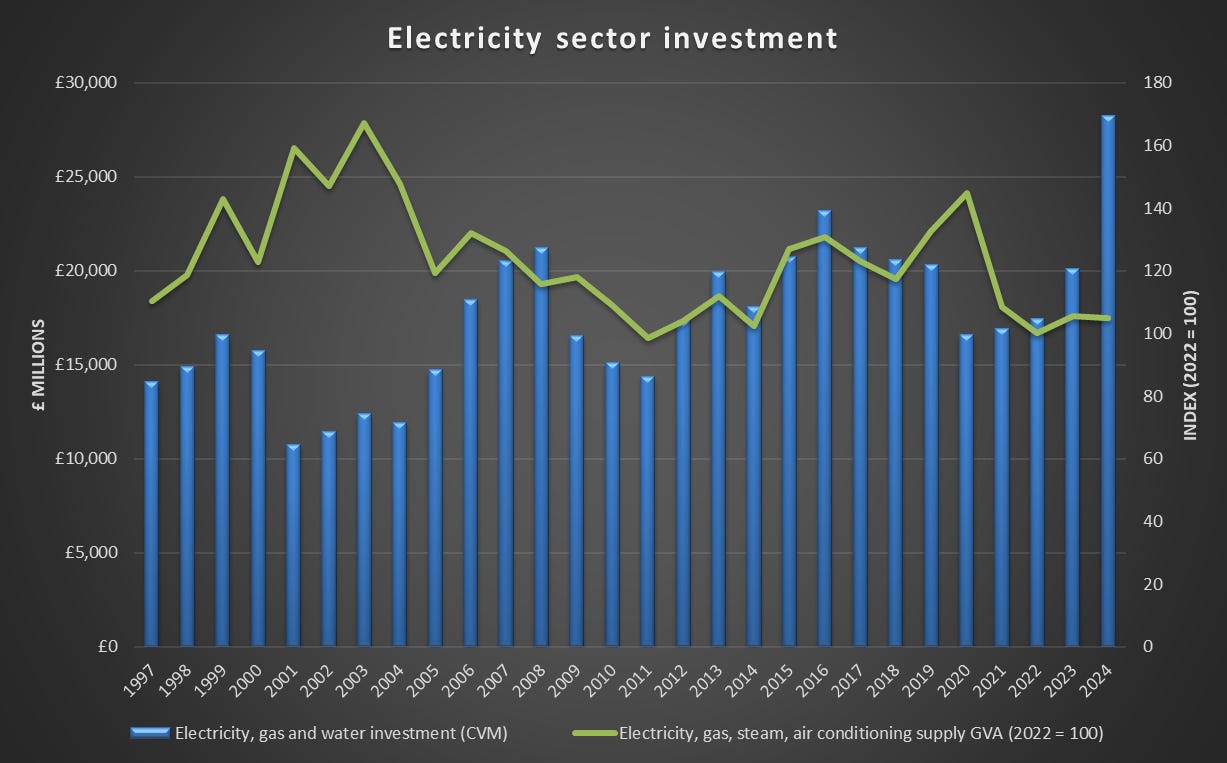
Investment doubled from £14 billion in 1997 to £28 billion in 2024.
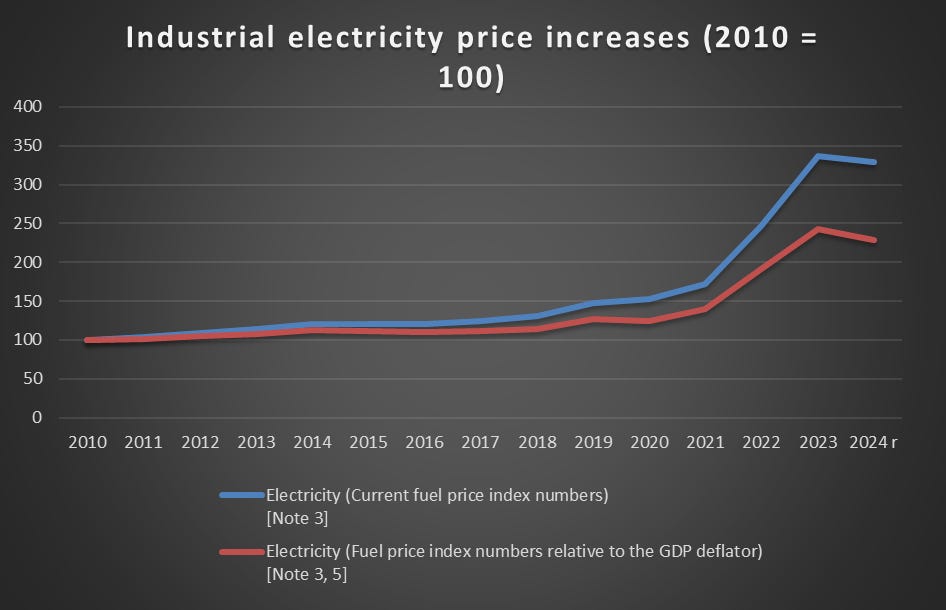
Electricity prices for industry, between 2010 and 2024, have grown 200% in current prices and over 100% in real terms.
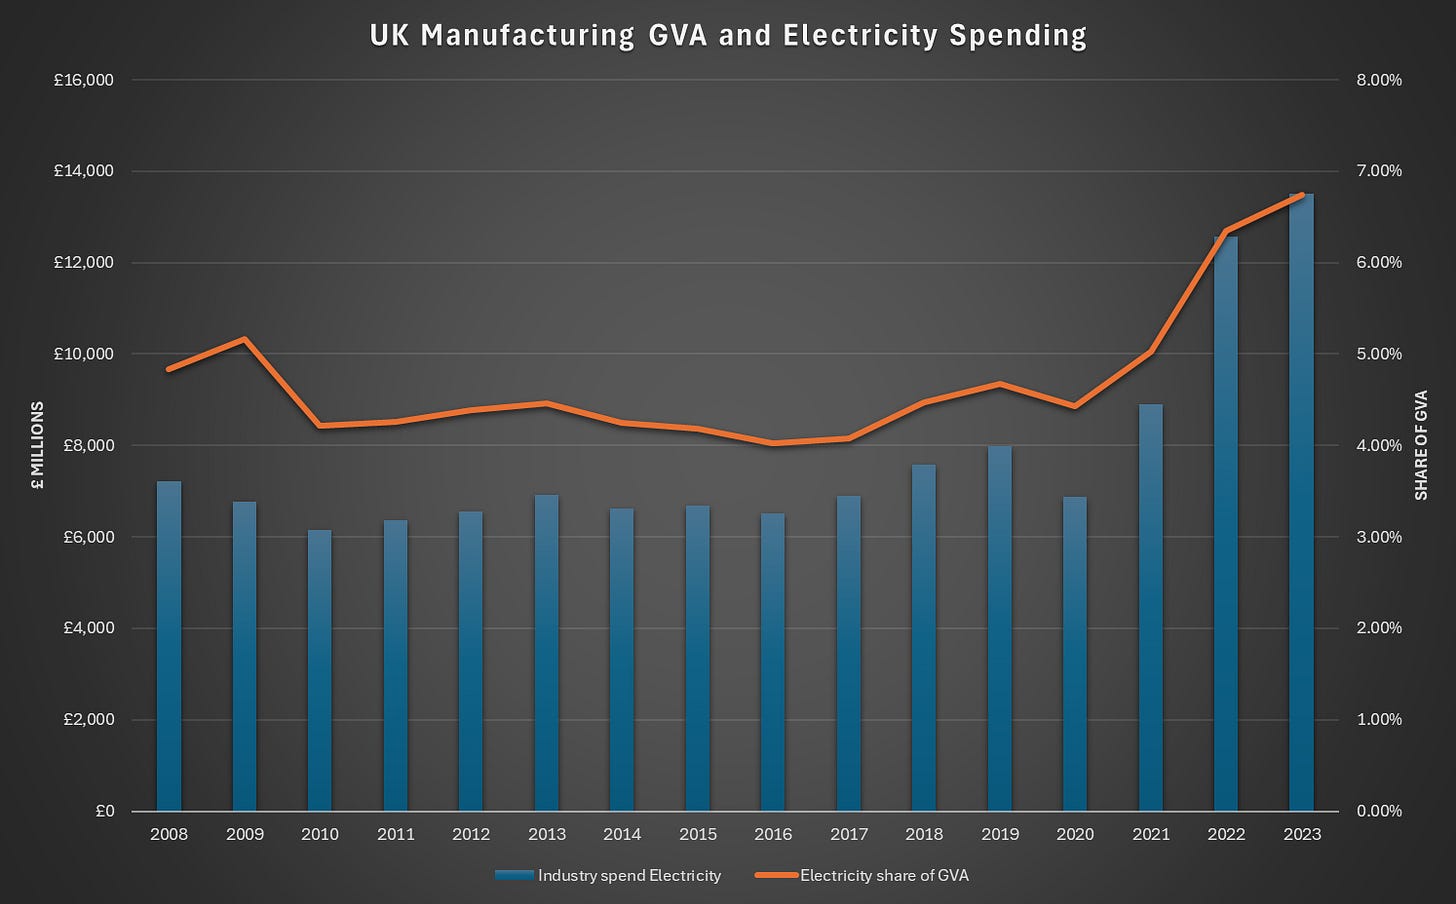
Electricity intensity (purchases as a share of GVA) for industry reached record highs in 2022 and 2023, despite low consumption.
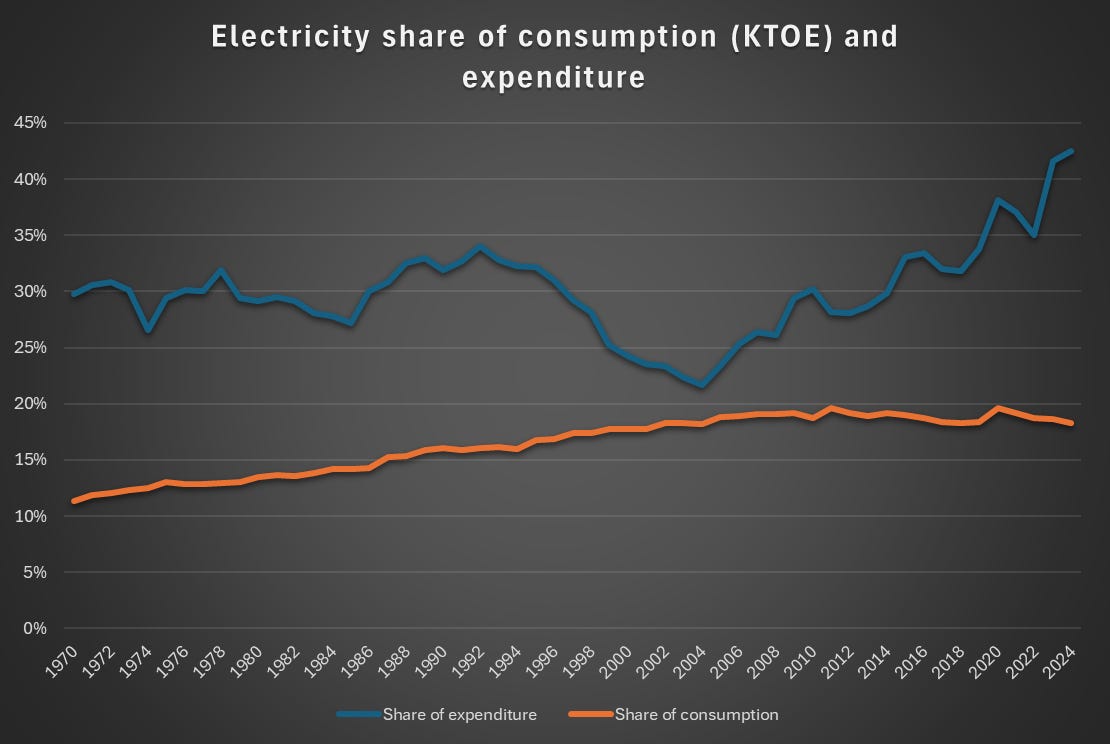
Electricity purchases have grown from 22% of energy expenditure in 2003 to 42% in 2024.
Despite this:
Gross value added for the power sector has declined since 2003.
The amount of electricity generated has declined just under 30% from 400 terrawatt-hours in 2005 to 285 TWh in 2024.
Electrification, the process of electrifying residential and industrial heat and transport, has basically flatlined since 2008.
The term I think best describes these developments is ‘Febrile decay’ – an abundance of activity running in combination with decline, and actual material production and consumption declining.
1: Electricity prices increase in absolute terms and become a bigger share of industrial spend.
We know that electricity costs have been rising. From 2010 to 2024, industrial electricity costs tripled in current prices and more than doubled in real terms.
Figure 1: Electricity price increase relative to GDP. Source: DUKES: Table 3.3.1 Fuel price indices for the industrial sector, excluding CCL, annually, United Kingdom.
Despite energy-intensive manufacturing stalling as a share of overall manufacturing, and actual electricity consumption declining, the electricity intensity of the manufacturing sector has increased due to high prices.
Figure 2: Industrial electricity spend in total and as a share of manufacturing GVA. Source: DUKES Table 1.1.6 Expenditure on energy by final user, £ million [note 1] / ONS Annual Business Survey 2024.
Electricity is not sufficiently displacing gas use to limit overall energy intensity. Energy intensity relative to GVA reached over 10% in 2023, a new high.
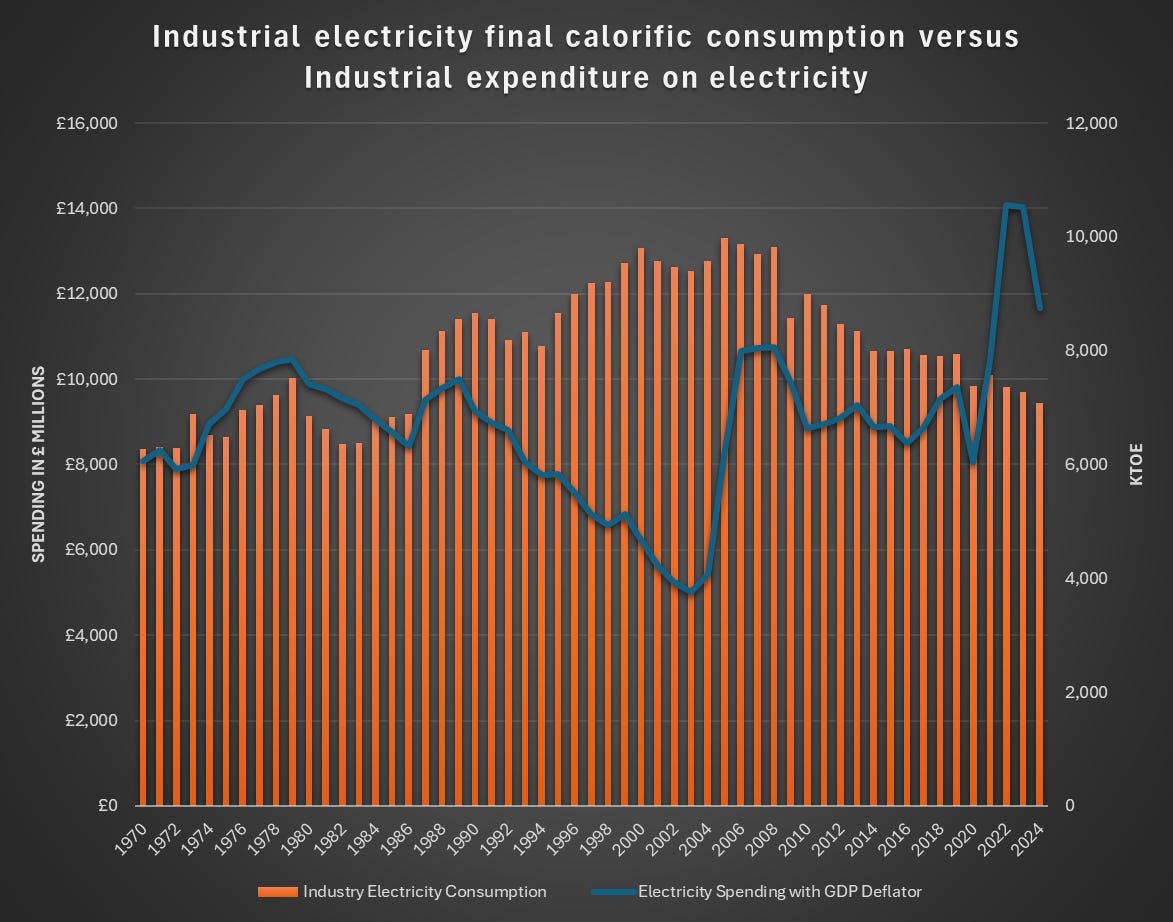
Below, we can see that industrial spending on electricity is increasing even as power consumption decreases. The positive trend from the 1990s to the mid-2000s shows consumption expanding in line with lower expenditure.
Figure 3: Industrial electricity consumption and expenditure. Source: DUKES 1.1.5. / DUKES 1.1.6.
2: The number of businesses has exploded.
In 2008, there were around 300 electricity producers in Britain. By 2016, it had grown to over 4,000, and reached 4,800 + in 2023. The number of businesses trading electricity rocketed from 9 in 2008 to 982 by 2021. The number of companies involved in the transmission of electricity grew from 10 in 2008 to 32 in 2022.
Figure 4: Number of power sector businesses versus generation. Source: ONS Annual Business Survey and DUKES 5.6
Figure 5: Compound Average Growth Rate (CAGR) in the number of enterprises by sector between 2008 and 2023. Source: ONS Annual Business Survey 2024
As can be seen above, the fecundity of power sector enterprise generation is not matched by the rest of British industry.
3: More hours for less generation
The explosive growth in businesses has been followed by the slower but still substantial uptick in the number of work hours going into electricity generation. Average total hours worked in electricity supply have grown 19% between 1997 and 2024, despite a decrease in electricity generation. In 2004, there were slightly more than three million weekly hours in the electricity supply sector. By 2024, it will be closer to five million. Meanwhile, electricity generation has continued to decline. The record for generation was 398 TWh in 2005. In 2024, it was 285 TWh. In 2006, it took 8 hours of individual work to generate a gigawatt-hour of electricity. Now it is 17 hours.
Figure 6: Average weekly hours worked in the power sector versus generation. Source: ONS and DUKES Table 5.6
4: Investment grows while GVA stalls
Investment in the power sector has doubled in real terms since 1997 to 2024, from £14 billion to £28 billion. But the sector’s gross value added has declined. This, I think, contradicts the idea that pumping subsidies into the power sector will lead to growth beyond energy rents.
Figure 7: Investment and GVA in the power sector. Source: Business investment by industry and asset, ONS.
5: Electrification has stalled
Unfortunately, decarbonising the power sector has not led to increased electrification. In fact, on an energy-supplied basis (measured in thousands of barrels of oil equivalent), electrification has basically stalled. This has not stopped the electricity share of energy spending from nearly doubling from 2003 to 2024. If you looked at Britain’s energy trends in 2004, you would be confident in electrification and therefore of harmonising decarbonisation with industrial growth. Instead, we have got more expensive electricity than ever, while our heating and transportation remain reliant on fuels.
Figure 8: Electricity shares of energy consumption and expenditure for the UK. Source: Expenditure data sourced from DUKES 1.1.6. Consumption sourced from DUKES Table 1.1.5 Energy consumption by final user (energy supplied basis).
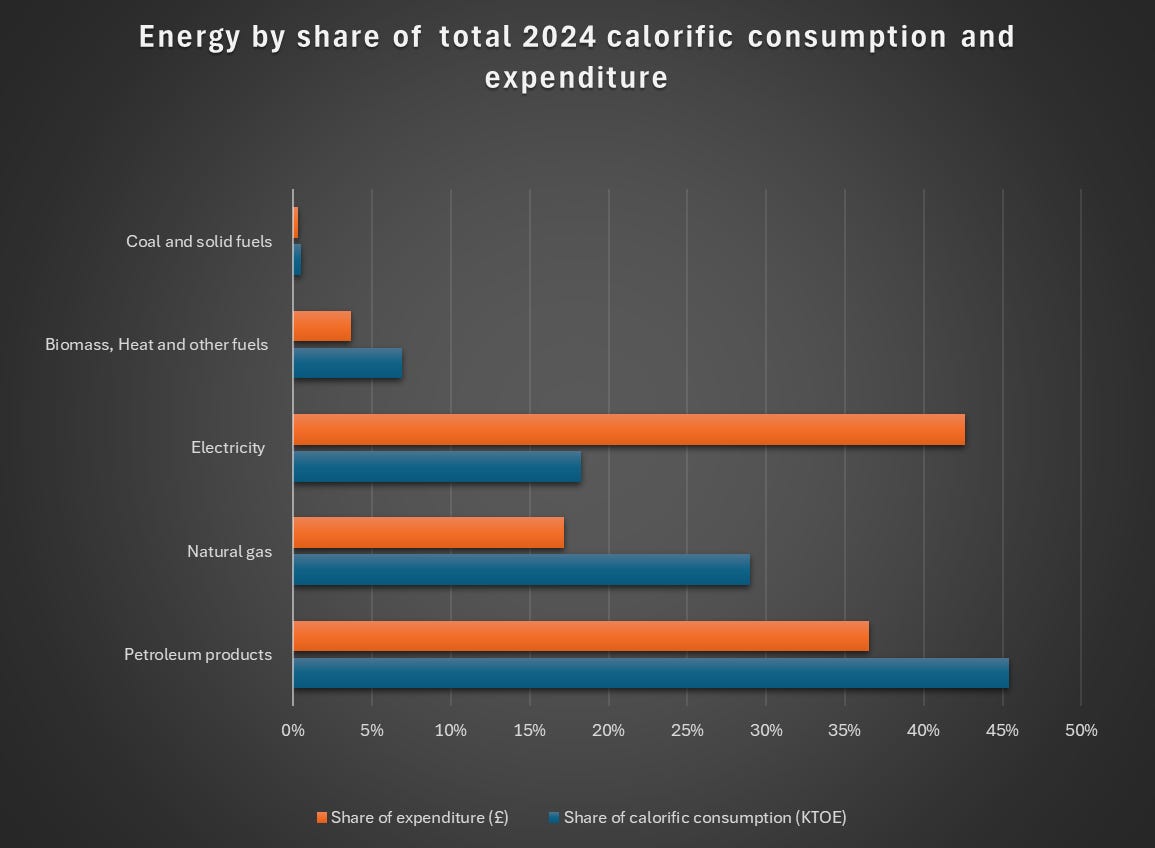
While electricity is only 18% of energy consumption, it is over 40% of the cost. As long as it is expensive, further decarbonisation is going to be very painful.
Figure 9: Electricity shares of consumption and expenditure for the UK 2024. Source: Expenditure data sourced from DUKES 1.1.6. Consumption sourced from DUKES Table 1.1.5 Energy consumption by final user (energy supplied basis).
That is all for this week.


